Decoding Single-Cell Clustering: Why More UMAP Clusters Don’t Mean More Cell Types
Date Published: March 18, 2025
Single-cell RNA sequencing (scRNA-seq) has revolutionized how we study cellular heterogeneity, enabling the discovery of rare cell populations and dynamic cell states. However, clustering results are often misinterpreted. This blog explains why more UMAP clusters do not necessarily indicate more biologically distinct cell types and how to avoid common pitfalls in scRNA-seq analysis.
Understanding Clustering in scRNA-seq
Clustering is based on gene expression similarities, often using Seurat (Satija et al., 2015) or Scanpy (Wolf et al., 2018). However, the number of clusters depends on:
- Resolution settings (higher resolution = more clusters)
- Feature selection (which genes are used)
- Batch effects and noise
Thus, clustering methods identify cell states rather than definitive cell types.
Cell Types vs. Cell States: What’s the Difference?
Cell Types: Stable populations with defined molecular signatures (e.g., neurons, T cells).
Cell States: Temporary functional phases (e.g., activated T cells, differentiating stem cells).
Many UMAP clusters represent states rather than unique cell types.
Why Clustering Can Overestimate Cell Types
1. UMAP Distorts High-Dimensional Space
UMAP exaggerates cluster separation, making continuous gradients appear as discrete groups.
2. Over-Resolution in Clustering Algorithms
Higher resolution settings can split biologically similar cells into separate clusters.
3. Pseudotemporal Continuums
Processes like differentiation can be mistaken for distinct cell types instead of a continuum.
4. Cell Cycle Effects
Uncorrected cell cycle states can create artificial clusters.
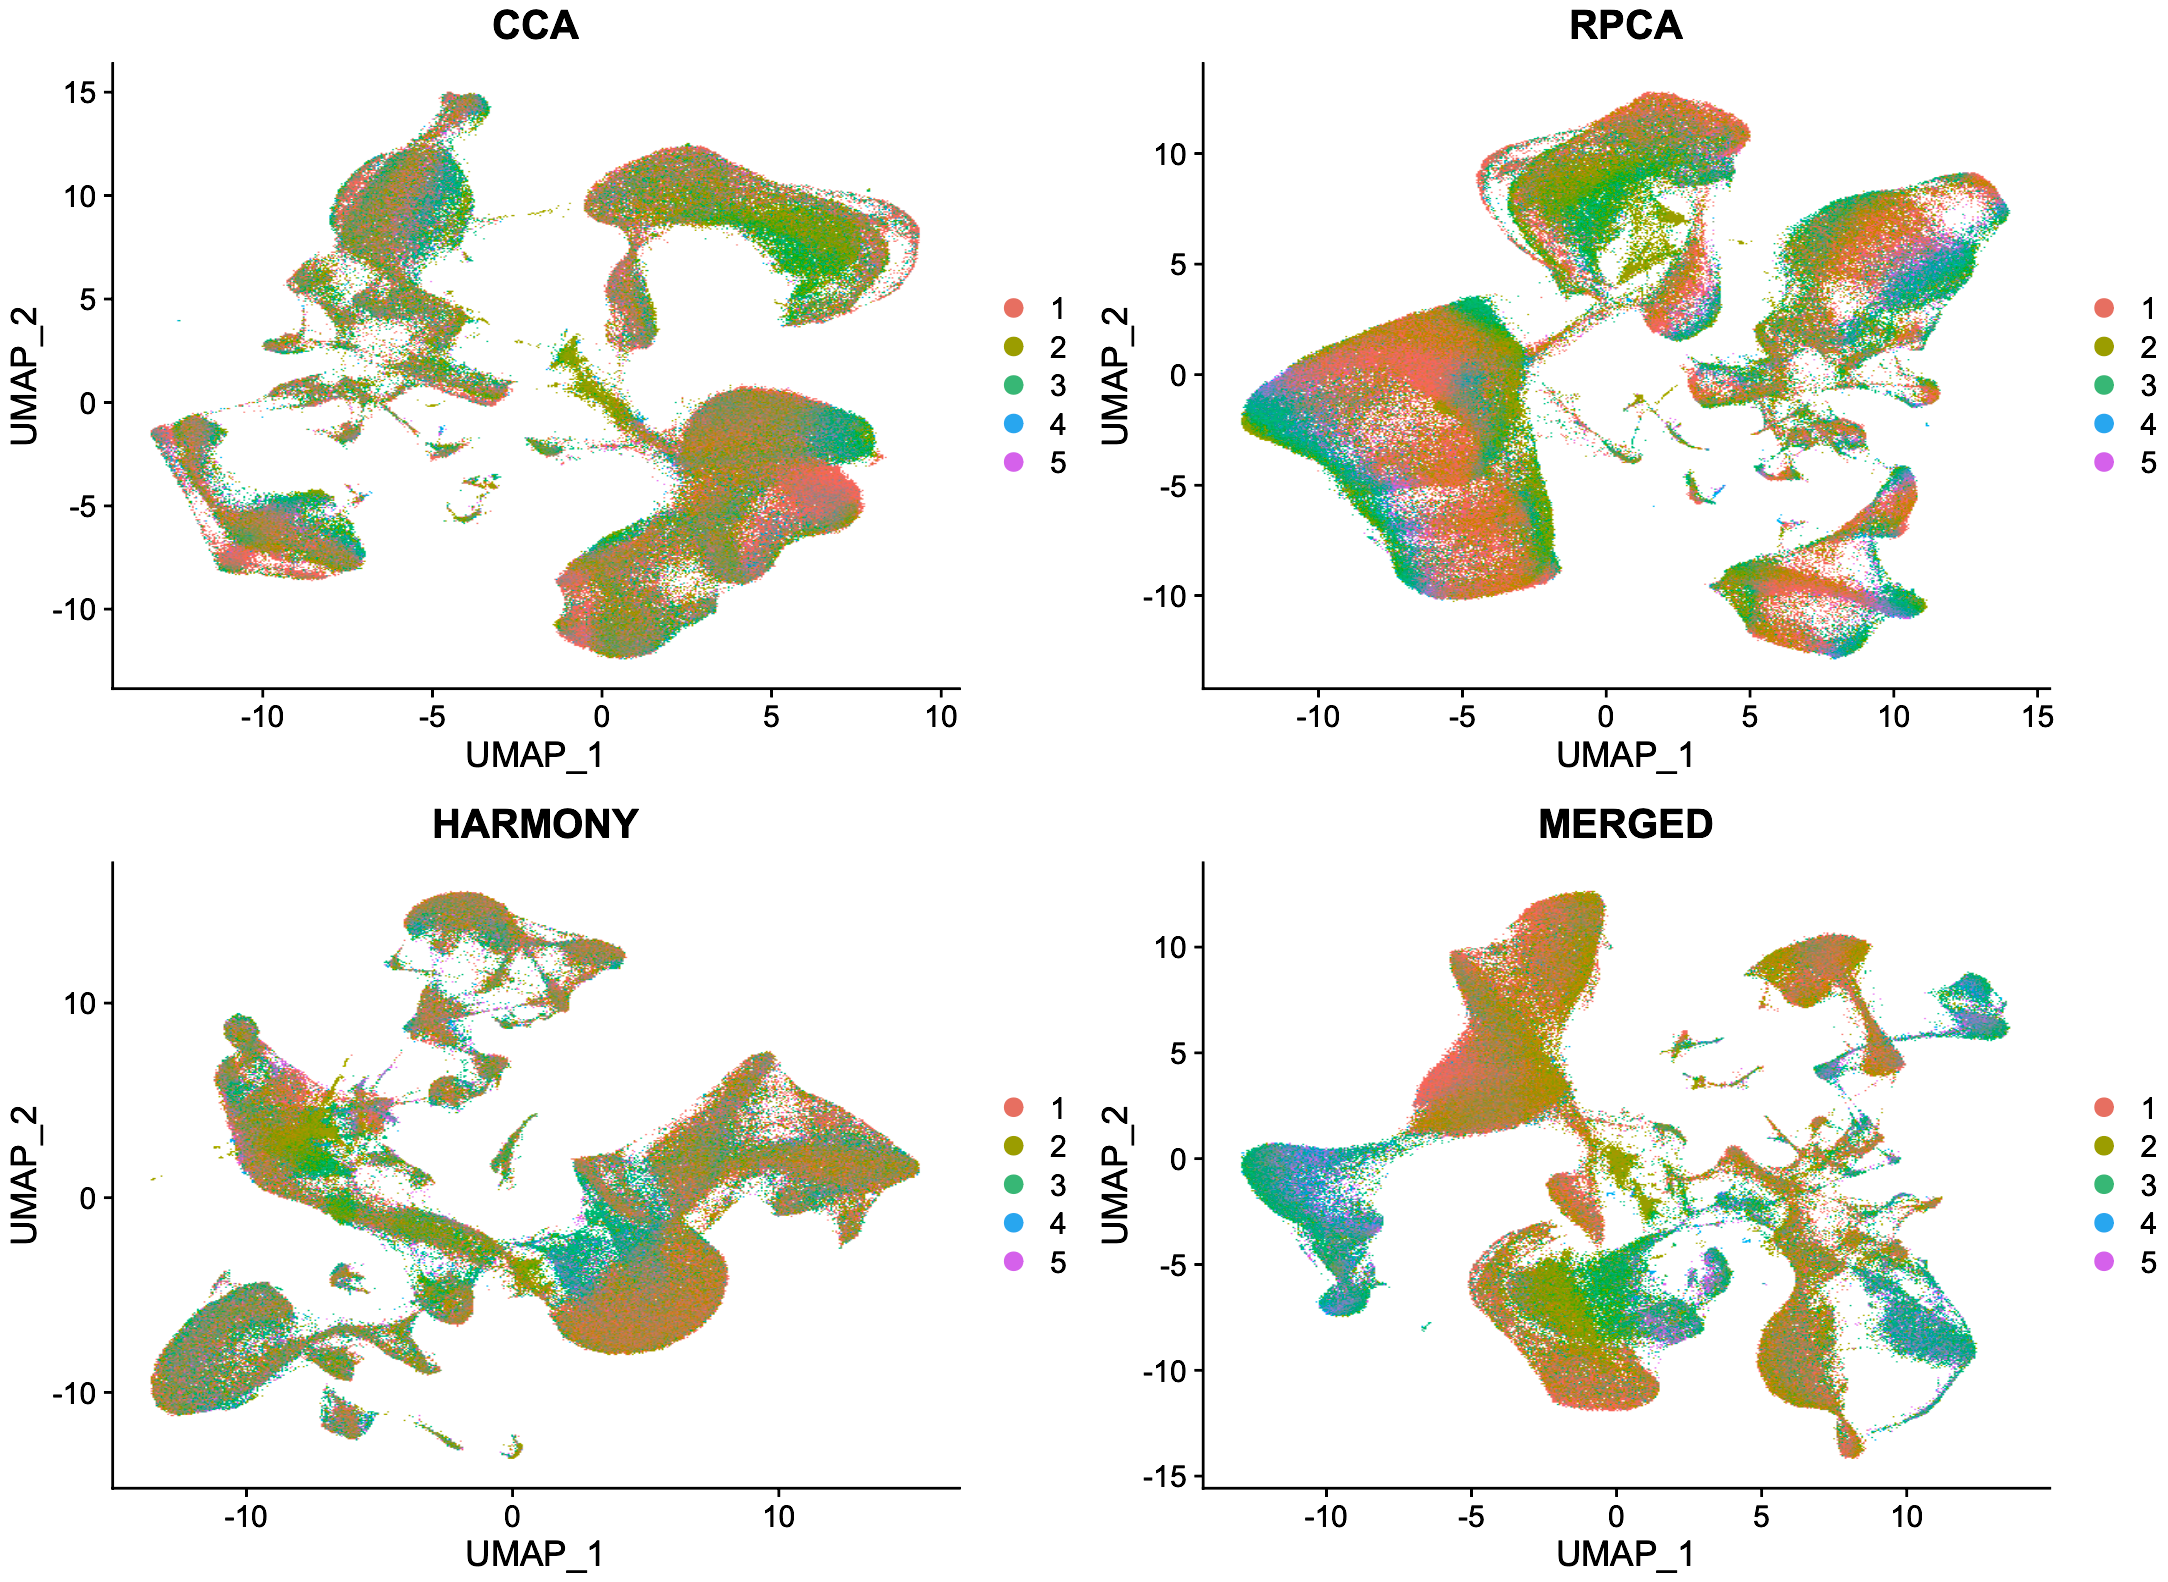
5. The Effect of Integration Methods on UMAP Clusters
My recent work with the single cell data analysis revealed that the appearance of UMAP clusters is not only affected by biological heterogeneity but also by the choice of integration method used to correct for batch effects. When the same dataset was integrated using CCA, RPCA, Harmony, and merged without correction, the resulting UMAP plots showed dramatically different cluster structures. This highlights the critical need to:
- Validate clustering consistency across methods.
- Choose integration strategies that preserve biological structure.
- Avoid equating visual UMAP separation with true biological distinctness.
How to Avoid Over-Interpretation
- Perform Marker-Based Annotation: Validate clusters using known gene markers.
- Use Additional Modalities: scATAC-seq, spatial transcriptomics, and CITE-seq improve annotation accuracy.
- Consider Pseudotime Analysis: Methods like Monocle and Slingshot model differentiation as a gradient.
- Optimize Clustering Parameters: Test multiple resolution settings for biological relevance.
Conclusion
Clustering and UMAP visualizations are valuable but should not be mistaken for true cell type classification. Careful validation using marker genes and multimodal data is essential for meaningful single-cell interpretations.
- ✔️ More UMAP clusters ≠ More cell types
- ✔️ Cell states are dynamic, while cell types are stable
- ✔️ Clustering resolution and technical artifacts can inflate heterogeneity
- ✔️ Marker-based annotation and multimodal validation are crucial
References
- Aran, D. et al. (2019). Reference-based analysis of lung single-cell sequencing reveals a transitional profibrotic macrophage. Nature Immunology, 20(2), 163-172.
- Kiselev, V. Y. et al. (2019). Challenges in unsupervised clustering of single-cell RNA-seq data. Nature Reviews Genetics, 20(5), 273-282.
- McInnes, L. et al. (2018). UMAP: Uniform Manifold Approximation and Projection for dimension reduction. arXiv preprint arXiv:1802.03426.
- Satija, R. et al. (2015). Spatial reconstruction of single-cell gene expression data. Nature Biotechnology, 33(5), 495-502.
- Lotfollahi, M. et al. (2022). Benchmarks of batch correction methods for single-cell RNA sequencing data integration. arXiv preprint arXiv:2206.01816.